Research · open data
Hiring Cost Atlas: what an employee costs employers in every US state
The Hiring Cost Atlas is the dataset behind our employee cost calculator: every employer payroll tax rate, wage base, employer-paid leave program and benefit average we use, for all 50 states, DC and the cities with their own rules — each value with its official source and the date it was checked. Free to reuse with attribution.
Cited by: USA TODAY and the Asheville Citizen-Times,
Key findings
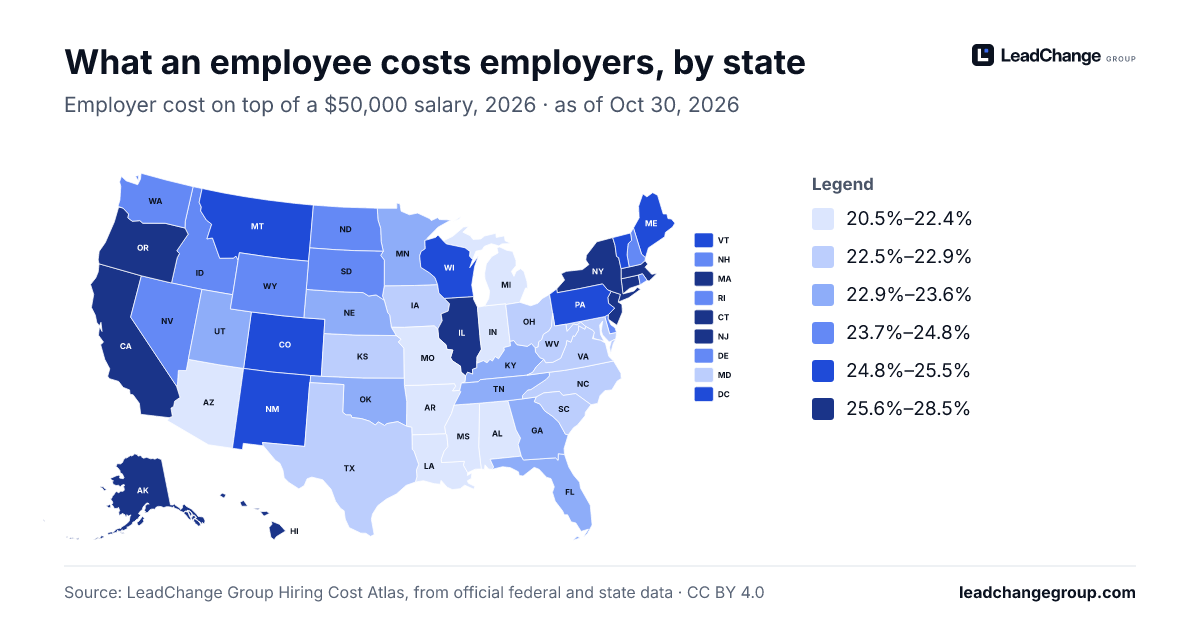
- On a $50,000 salary, employer costs on top of pay run from 20.5% in Arkansas to 28.5% in New York in 2026.
- State unemployment insurance wage bases range from $7,000 to $78,200 per employee in 2026.
- 9 jurisdictions charge employers a paid leave or disability premium; 18 require paid sick leave statewide in the laws we verified.
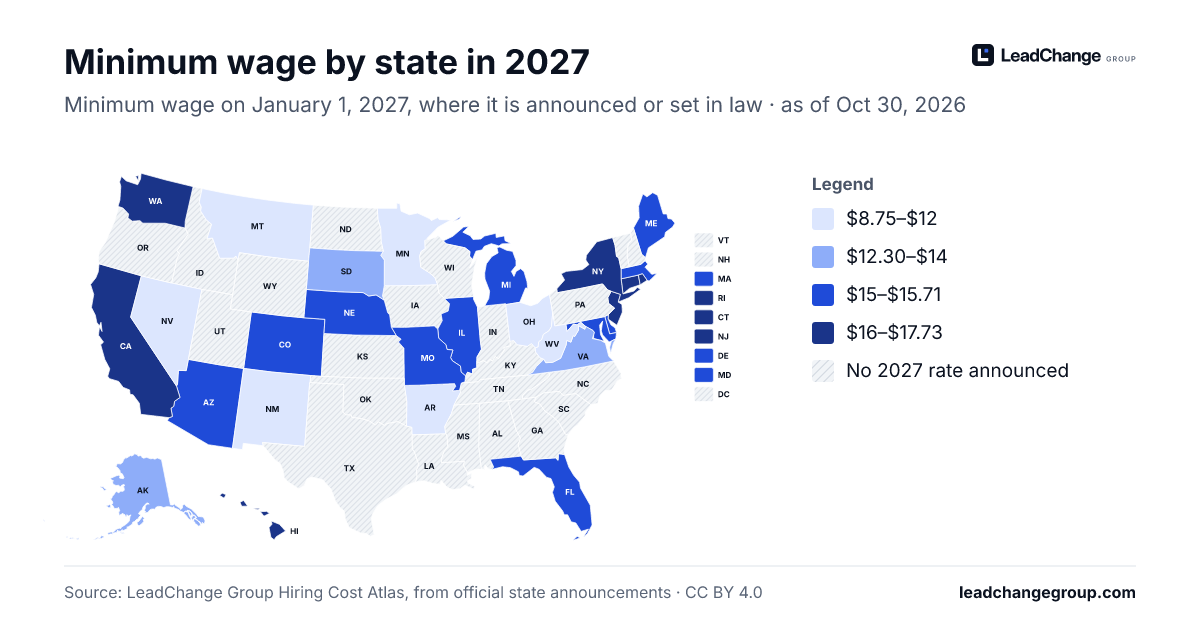
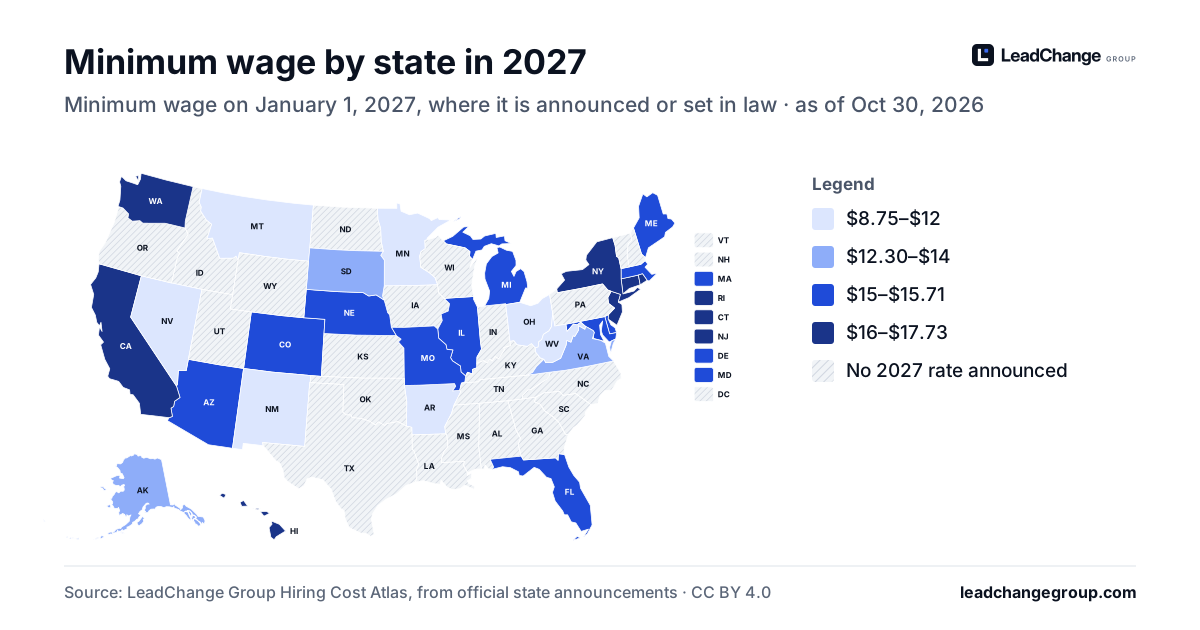
- 16 states raise their minimum wage on January 1, 2027 (plus Alaska on Jul 1, 2027); 6 cities have announced a higher 2027 rate, as of Nov 12, 2026.
Map: the cost of an employee by state
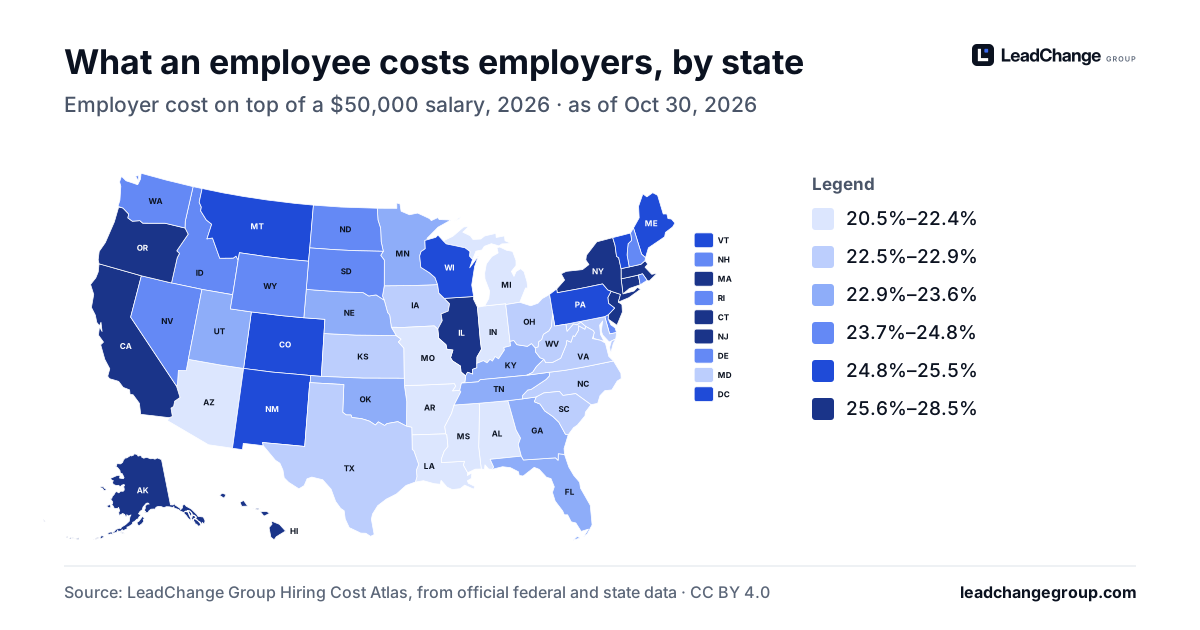
Employer cost on top of a $50,000 salary, 2026
- 20.5%–22.4%
- 22.5%–22.9%
- 22.9%–23.6%
- 23.7%–24.8%
- 24.8%–25.5%
- 25.6%–28.5%
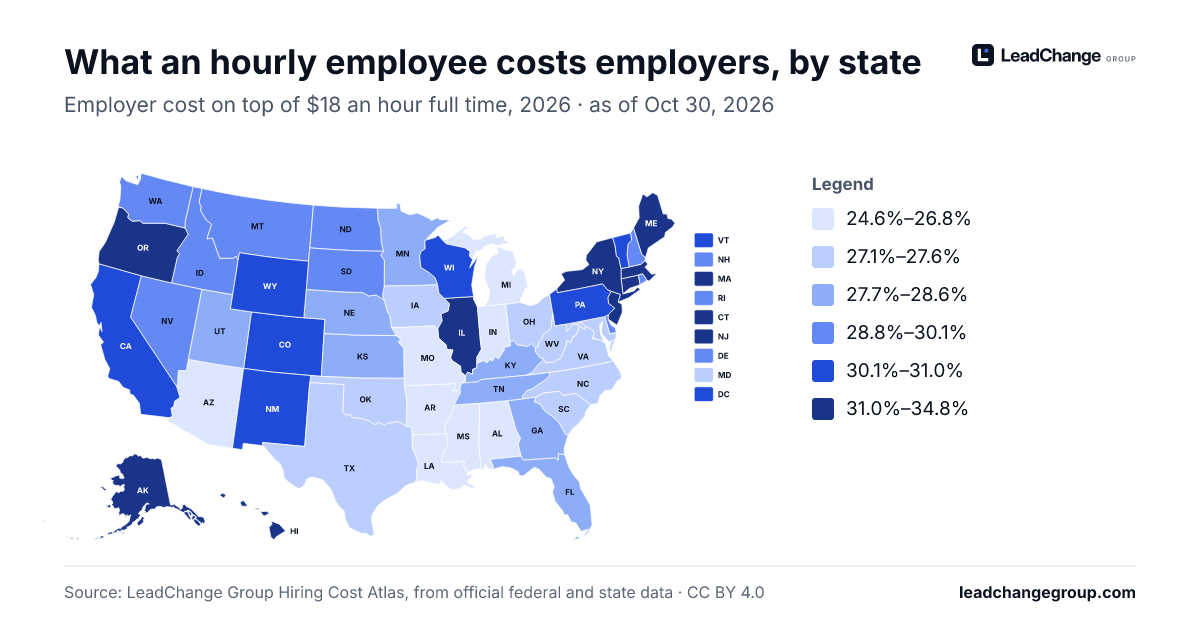
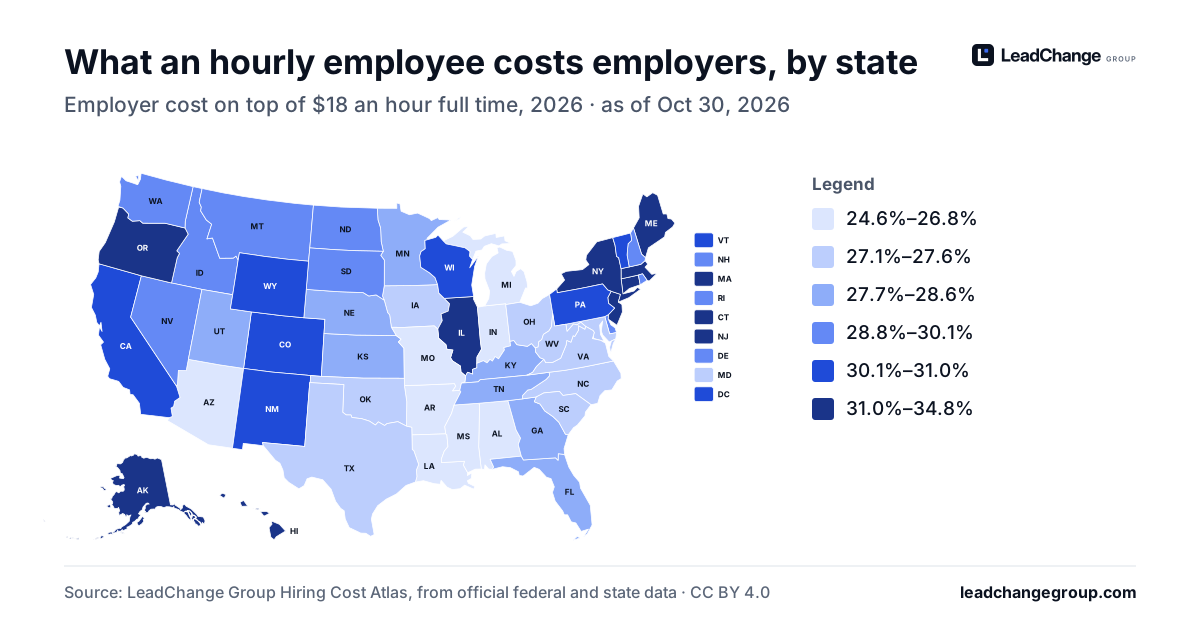
Employer cost on top of $18 an hour full time, 2026
- 24.6%–26.8%
- 27.1%–27.6%
- 27.7%–28.6%
- 28.8%–30.1%
- 30.1%–31.0%
- 31.0%–34.8%
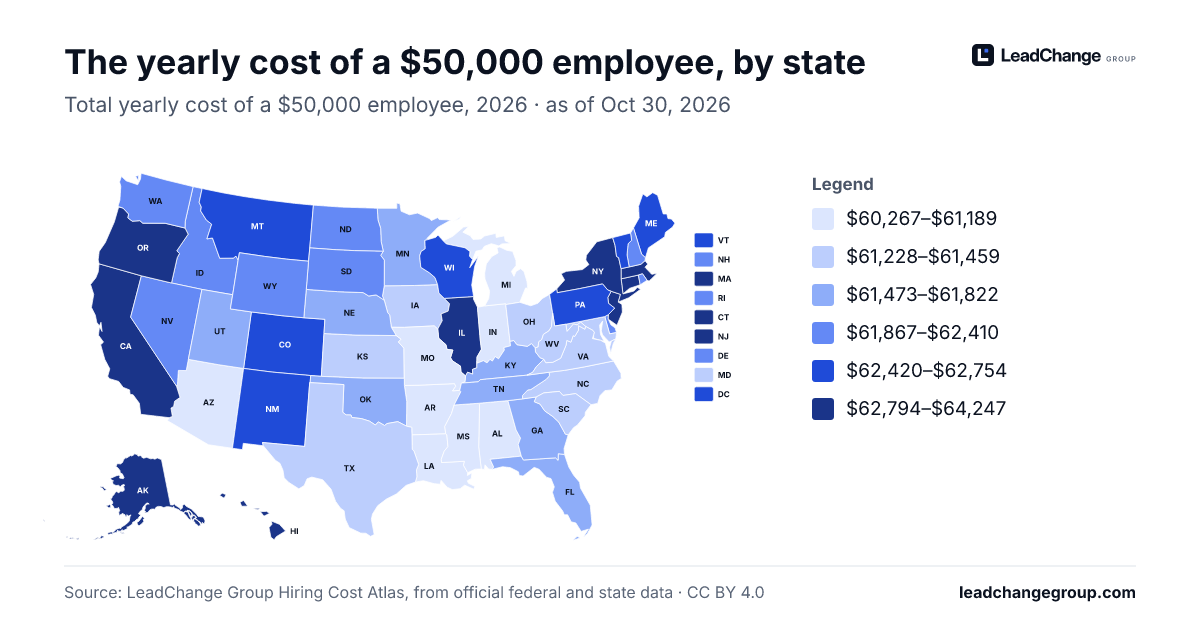
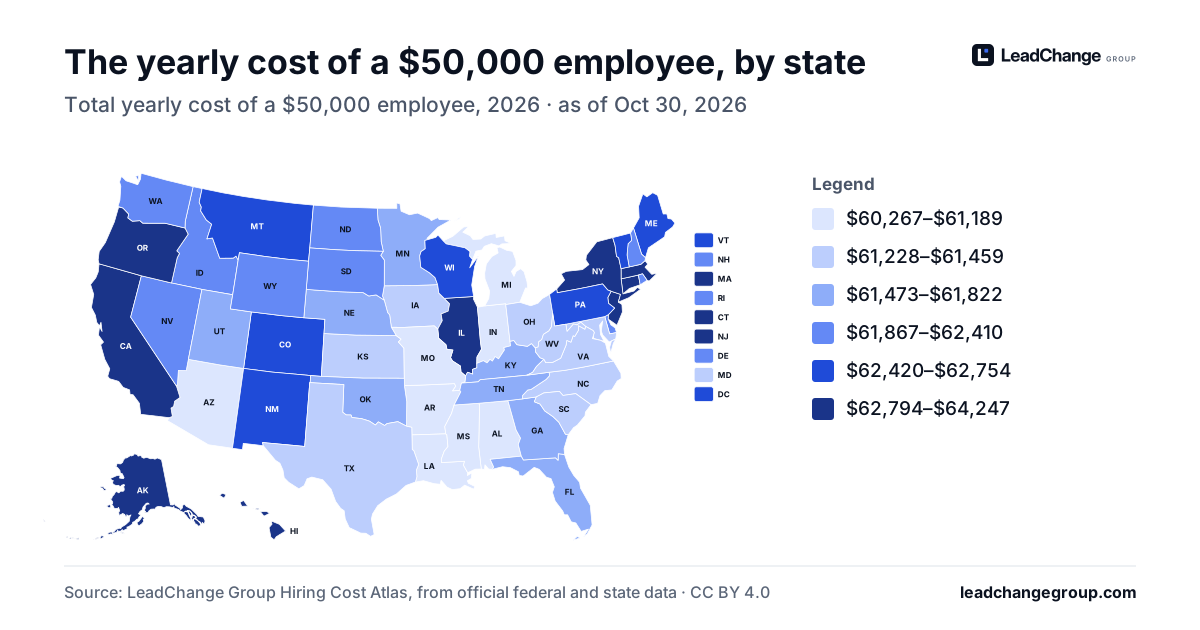
Total yearly cost of a $50,000 employee, 2026
- $60,267–$61,189
- $61,228–$61,459
- $61,473–$61,822
- $61,867–$62,410
- $62,420–$62,754
- $62,794–$64,247
Employer cost of an employee by state, 2026
Employer cost on top of pay for one full-time employee in 2026, highest first. Select a state for its full breakdown and sources.
| Rank | State | On top of a $50,000 salary | Total cost | On top of $18 an hour | Total cost |
|---|---|---|---|---|---|
| 1 | New York | 28.5% | $64,247 | 34.8% | $50,478 |
| 2 | New Jersey | 27.9% | $63,945 | 33.3% | $49,910 |
| 3 | Hawaii | 27.5% | $63,755 | 32.5% | $49,616 |
| 4 | Alaska | 27.3% | $63,646 | 33.2% | $49,854 |
| 5 | Connecticut | 26.7% | $63,336 | 32.6% | $49,629 |
| 6 | Oregon | 26.5% | $63,238 | 31.7% | $49,304 |
| 7 | Massachusetts | 26.2% | $63,113 | 32.1% | $49,470 |
| 8 | Illinois | 25.6% | $62,802 | 31.2% | $49,113 |
| 9 | California | 25.6% | $62,794 | 31.0% | $49,040 |
| 10 | Maine | 25.5% | $62,754 | 31.0% | $49,061 |
| 11 | District of Columbia | 25.5% | $62,749 | 31.0% | $49,042 |
| 12 | Colorado | 25.5% | $62,743 | 31.0% | $49,035 |
| 13 | Vermont | 25.3% | $62,638 | 30.7% | $48,916 |
| 14 | Pennsylvania | 25.1% | $62,571 | 30.6% | $48,907 |
| 15 | Wisconsin | 25.0% | $62,509 | 30.4% | $48,810 |
| 16 | Montana | 25.0% | $62,501 | 30.1% | $48,696 |
| 17 | New Mexico | 24.8% | $62,420 | 30.3% | $48,767 |
| 18 | Wyoming | 24.8% | $62,410 | 30.1% | $48,712 |
| 19 | Washington | 24.7% | $62,373 | 29.7% | $48,557 |
| 20 | North Dakota | 24.6% | $62,322 | 29.9% | $48,647 |
| 21 | Rhode Island | 24.4% | $62,207 | 29.6% | $48,513 |
| 22 | Nevada | 24.3% | $62,173 | 29.2% | $48,376 |
| 23 | New Hampshire | 24.0% | $62,007 | 29.1% | $48,333 |
| 24 | Idaho | 24.0% | $62,001 | 28.8% | $48,216 |
| 25 | Delaware | 23.8% | $61,916 | 28.9% | $48,253 |
| 26 | South Dakota | 23.7% | $61,867 | 28.8% | $48,204 |
| 27 | Georgia | 23.6% | $61,822 | 28.6% | $48,164 |
| 28 | Nebraska | 23.4% | $61,725 | 28.4% | $48,063 |
| 29 | Minnesota | 23.4% | $61,689 | 28.0% | $47,918 |
| 30 | Florida | 23.1% | $61,562 | 28.0% | $47,916 |
| 31 | Kentucky | 23.1% | $61,560 | 28.1% | $47,944 |
| 32 | Utah | 23.1% | $61,539 | 27.7% | $47,813 |
| 33 | Tennessee | 23.0% | $61,478 | 27.8% | $47,857 |
| 34 | Oklahoma | 22.9% | $61,473 | 27.6% | $47,785 |
| 35 | Kansas | 22.9% | $61,459 | 27.7% | $47,824 |
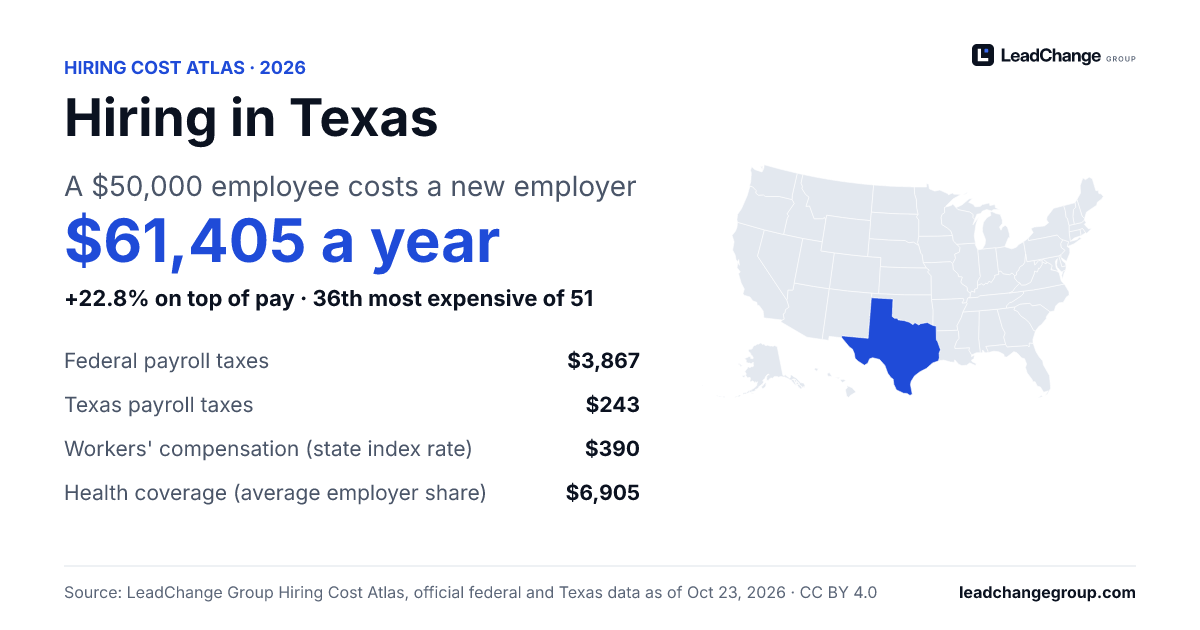
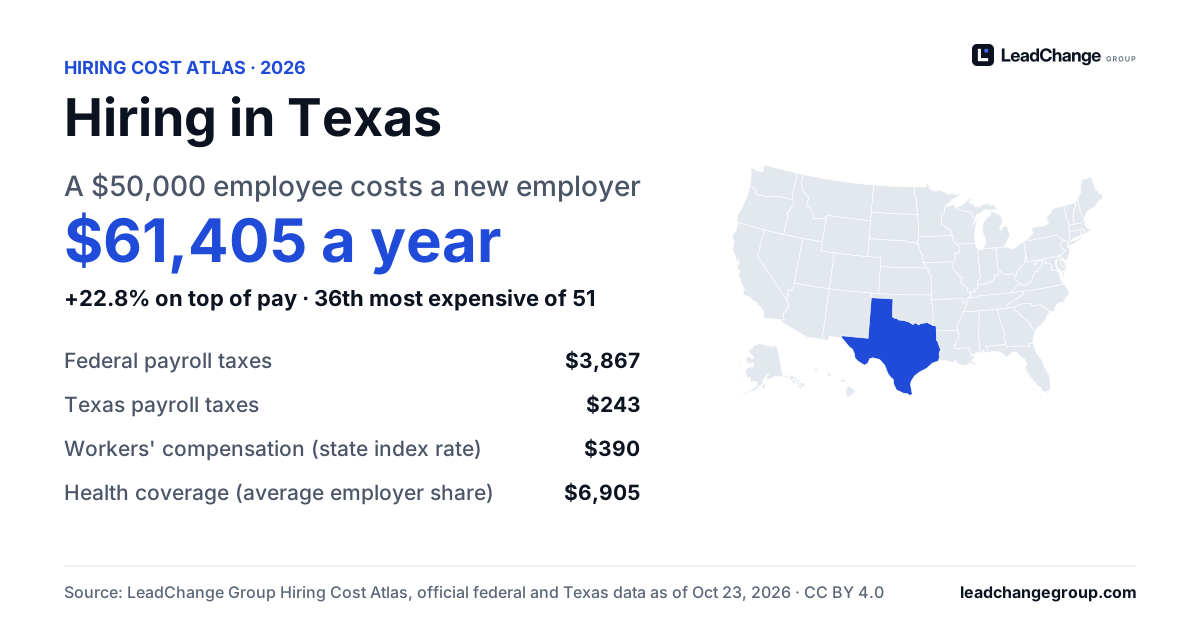
| 36 | Texas | 22.8% | $61,405 | 27.6% | $47,786 |
| 37 | Virginia | 22.7% | $61,348 | 27.5% | $47,735 |
| 38 | North Carolina | 22.6% | $61,284 | 27.3% | $47,644 |
| 39 | Iowa | 22.5% | $61,271 | 27.1% | $47,598 |
| 40 | South Carolina | 22.5% | $61,260 | 27.2% | $47,610 |
| 41 | West Virginia | 22.5% | $61,260 | 27.3% | $47,671 |
| 42 | Ohio | 22.5% | $61,238 | 27.2% | $47,632 |
| 43 | Maryland | 22.5% | $61,228 | 27.1% | $47,595 |
| 44 | Louisiana | 22.4% | $61,189 | 26.8% | $47,491 |
| 45 | Missouri | 22.3% | $61,171 | 26.8% | $47,485 |
| 46 | Michigan | 21.6% | $60,820 | 26.0% | $47,186 |
| 47 | Alabama | 21.5% | $60,759 | 25.8% | $47,099 |
| 48 | Indiana | 21.4% | $60,678 | 25.7% | $47,067 |
| 49 | Mississippi | 20.7% | $60,373 | 24.8% | $46,734 |
| 50 | Arizona | 20.5% | $60,274 | 24.6% | $46,665 |
| 51 | Arkansas | 20.5% | $60,267 | 24.7% | $46,680 |
A new employer with 10 employees in a general industry, a $50,000 salary or $18 an hour for 40 hours a week, single health coverage at the state average and required paid sick leave. The $18 column is below the minimum wage in a few places and is shown for comparison.
How we collect the data
Every value comes from an official source: a federal or state agency, a statute or an official rate notice. We record the page, the agency, the words that state the value and the day we checked it. Where we could not read an official source, the value is left out and the line is not added to any estimate.
How often it is updated
We check every source again every 30 days and whenever an agency announces new rates — most states publish next year's unemployment insurance rates between October and December, and paid leave programs announce theirs in the fall. A changed value is updated in the dataset and on every page that shows it.
Corrections
If you find a value that differs from its official source, tell us through the corrections form. We review every request against the source.
Changes to the data
Data version 2026.11.13: the newest day a value was checked against its source. The archived copies on Zenodo, GitHub and Kaggle carry the same version.
Corrections to published values, newest first (all of them are in our correction log):
- Nov 11, 2026. The Hiring Cost Atlas said 7 cities had announced a higher 2027 minimum wage. The count included every city with a 2027 rate, among them New York City, whose 2027 rate ($17.00) is the same as its 2026 rate. Now: The count includes only cities whose 2027 rate is above their 2026 rate: 6 (Seattle, Denver, San Jose, San Diego, Minneapolis and Saint Paul).
- Nov 11, 2026. California's employer cost page still said the final 2026 FUTA credit reduction «is set on November 10, 2026» after that day, next to the U.S. Department of Labor's potential 1.5% figure. Now: The page says the Department had not published its final 2026 reduction by November 11, 2026; the potential 1.5% is used until it does.
- Oct 30, 2026. The Hiring Cost Atlas showed the City of Los Angeles paid sick leave rule (48 hours a year) as a Louisiana law, which Louisiana does not have, and cited the 1% new-employer unemployment rate of Louisiana, Utah and Wyoming to Washington State's agency. Now: Louisiana shows no state paid sick leave requirement, with the state law that bars local ones; its cost per hour worked is $29.42, not $30.11, on a $50,000 salary. The 1% rate cites federal law (26 U.S.C. § 3303). The open data counts 17 jurisdictions with a verified statewide sick leave law, not 18.
Download the data
Every value with its official source and the day it was checked. Free to reuse, including commercially, with attribution.
Read-only API (JSON, cached): https://leadchangegroup.com/api/hiring-cost-atlas/v1/states/ lists every state; add a state's slug for its parameters and sources, for example/api/hiring-cost-atlas/v1/states/texas/.
License: CC BY 4.0.
Images for press
Free to use with attribution to LeadChange Group (CC BY 4.0): 1200 × 630, PNG for the web, SVG for print. Each carries its source line.
- Employer cost map: employer cost on top of a $50,000 salary: PNG · SVG
- Employer cost map: employer cost on top of $18 an hour full time: PNG · SVG
- Employer cost map: total yearly cost of a $50,000 employee: PNG · SVG
- Minimum wage by state in 2027: PNG · SVG
- A card for every state, for example Texas: PNG · SVG (each state page links its own)
Columns
jurisdiction- State (two-letter code) or city
jurisdiction_type- federal, state or city
year- Calendar year the value applies to
measure- What the value is (see the methodology on this page)
value- The number
unit- percent, usd, usd_per_100_payroll, usd_per_hour, usd_per_month, hours, employees
effective- Date the value applies from (or the survey or study edition)
carried_from_2026- 1 when the 2027 value is not published yet and the 2026 value is shown
source_url- Official page the value comes from
publisher- Agency that publishes it
verified_at- Day the value was last checked against its source
Official sources
- Social Security wage base and tax rates Social Security Administration · 2026 and 2027 · checked Oct 23, 2026
- FUTA tax rate, credit and wage base Internal Revenue Service · 2026 · checked Oct 23, 2026
- Significant Provisions of State Unemployment Insurance Laws, effective January 2026 U.S. Department of Labor, Employment and Training Administration · Jan 1, 2026 · checked Oct 23, 2026
- Oregon Workers’ Compensation Premium Rate Ranking Oregon Department of Consumer and Business Services · 2024 (rates as of January 1, 2024) · checked Oct 23, 2026
- Medical Expenditure Panel Survey–Insurance Component, private-sector state tables (Tables II.C.1, II.C.2, II.D.1, II.D.2) Agency for Healthcare Research and Quality · 2025 · checked Oct 23, 2026
- US: social security rate Internal Revenue Service · Jan 1, 2026 · checked Oct 31, 2026
- US: minimum wage U.S. Department of Labor, Wage and Hour Division · Jul 24, 2009 · checked Oct 8, 2026
- AL: minimum wage U.S. Department of Labor, Wage and Hour Division · Nov 3, 2026 · checked Nov 3, 2026
- AL: workers comp index rate Oregon Department of Consumer and Business Services · Jan 1, 2024 · checked Nov 4, 2026
- AK: minimum wage Alaska Department of Labor and Workforce Development · Jul 1, 2026 · checked Nov 3, 2026
- AK: minimum wage Alaska Department of Labor and Workforce Development · Jul 1, 2026 · checked Nov 3, 2026
- AK: paid sick leave hours worked per hour 1 14 employees Alaska Department of Labor and Workforce Development · Jul 1, 2025 · checked Oct 23, 2026
- AZ: minimum wage Industrial Commission of Arizona · Jan 1, 2027 · checked Oct 25, 2026
- AZ: paid sick leave hours worked per hour 1 14 employees Arizona Legislature (A.R.S. § 23-372) · Jul 1, 2017 · checked Oct 23, 2026
- AR: minimum wage Arkansas Department of Labor and Licensing · Jan 1, 2021 · checked Nov 3, 2026
- CA: sui new employer rate California Employment Development Department · Jan 1, 2026 · checked Oct 23, 2026
- CA: futa credit reduction potential U.S. Department of Labor, Employment and Training Administration · Nov 10, 2026 · checked Nov 11, 2026
- CA: minimum wage California Department of Industrial Relations · Jan 1, 2027 · checked Nov 3, 2026
- CA: minimum wage California Department of Industrial Relations · Jan 1, 2026 · checked Nov 3, 2026
- CA: paid sick leave hours worked per hour 1 plus employees California Labor Commissioner (DIR) · Jan 1, 2024 · checked Oct 23, 2026
- CO: sui new employer rate Colorado Department of Labor and Employment · Jan 1, 2026 · checked Oct 23, 2026
- CO: co famli employer rate 10 plus employees Colorado FAMLI Division (CDLE) · Jan 1, 2026 · checked Nov 13, 2026
- CO: sui wage base Colorado Department of Labor and Employment · Jan 1, 2027 · checked Oct 23, 2026
- CO: co famli employer rate 10 plus employees Colorado Department of Labor and Employment · Jan 1, 2027 · checked Oct 23, 2026
- CO: minimum wage Colorado Department of Labor and Employment · Jan 1, 2027 · checked Nov 3, 2026
- CO: paid sick leave hours worked per hour 1 plus employees Colorado Department of Labor and Employment · Jan 1, 2022 · checked Oct 23, 2026
- CT: minimum wage Office of the Governor of Connecticut · Jan 1, 2027 · checked Nov 3, 2026
- CT: paid sick leave hours worked per hour 11 plus employees Connecticut Department of Labor · Jan 1, 2026 · checked Oct 23, 2026
- DE: de paid leave employer rate 10 24 employees Delaware Department of Labor · Jan 1, 2026 · checked Nov 2, 2026
- DE: sui wage base Delaware Code, Title 19, § 3302 · Jan 1, 2027 · checked Nov 11, 2026
- DE: minimum wage Delaware Code, Title 19, § 902 · Jan 1, 2025 · checked Nov 3, 2026
- DE: minimum wage Delaware Department of Labor · Jan 1, 2025 · checked Nov 3, 2026
- DC: dc paid leave employer rate 1 plus employees DC Department of Employment Services, Office of Paid Family Leave · Jan 1, 2026 · checked Nov 2, 2026
- DC: minimum wage DC Department of Employment Services · Jul 1, 2026 · checked Nov 3, 2026
- DC: minimum wage DC Department of Employment Services · Jul 1, 2026 · checked Nov 3, 2026
- DC: paid sick leave hours worked per hour 1 24 employees DC Department of Employment Services · Feb 22, 2014 · checked Oct 23, 2026
- FL: minimum wage FloridaCommerce · Sep 30, 2026 · checked Nov 3, 2026
- GA: minimum wage Georgia Department of Labor · Nov 3, 2026 · checked Nov 3, 2026
- HI: minimum wage Hawaii Department of Labor and Industrial Relations · Jan 1, 2026 · checked Nov 3, 2026
- IL: minimum wage Illinois Department of Labor · Jan 1, 2025 · checked Nov 3, 2026
- IL: minimum wage Illinois Department of Labor · Jan 1, 2025 · checked Nov 3, 2026
- IL: paid sick leave hours worked per hour 1 plus employees Illinois Department of Labor · Jan 1, 2024 · checked Oct 23, 2026
- IN: minimum wage Indiana Department of Labor · Nov 3, 2026 · checked Nov 3, 2026
- IA: sui new employer rate Iowa Workforce Development · Jan 1, 2026 · checked Nov 2, 2026
- IA: sui wage base Iowa Workforce Development · Jan 1, 2027 · checked Nov 11, 2026
- IA: sui new employer rate Iowa Workforce Development · Jan 1, 2027 · checked Oct 23, 2026
- IA: minimum wage Iowa Department of Inspections, Appeals, and Licensing · Nov 3, 2026 · checked Nov 3, 2026
- LA: sui new employer rate minimum U.S. Government Publishing Office (26 U.S.C. § 3303) · Jan 1, 2026 · checked Oct 30, 2026
- ME: me pfml employer rate 15 plus employees Maine Department of Labor, Paid Family and Medical Leave · Jan 1, 2025 · checked Oct 23, 2026
- ME: minimum wage Maine Department of Labor · Jan 1, 2027 · checked Nov 3, 2026
- ME: paid sick leave hours worked per hour 11 plus employees Maine Department of Labor · Jan 1, 2026 · checked Oct 23, 2026
- MD: minimum wage Maryland Department of Labor · Jan 1, 2024 · checked Nov 3, 2026
- MD: paid sick leave hours worked per hour 15 plus employees Maryland Department of Labor · Feb 11, 2018 · checked Oct 23, 2026
- MA: ma pfml employer rate 25 plus employees Massachusetts Department of Family and Medical Leave · Jan 1, 2026 · checked Oct 23, 2026
- MA: minimum wage Commonwealth of Massachusetts · Jan 1, 2023 · checked Nov 3, 2026
- MA: minimum wage Massachusetts Attorney General’s Office · Jan 1, 2023 · checked Nov 3, 2026
- MA: paid sick leave hours worked per hour 11 plus employees Massachusetts Attorney General's Office · Jan 1, 2026 · checked Oct 23, 2026
- MI: minimum wage Michigan Department of Labor and Economic Opportunity · Jan 1, 2027 · checked Nov 3, 2026
- MI: paid sick leave hours worked per hour 1 10 employees Michigan Department of Labor and Economic Opportunity · Feb 21, 2025 · checked Oct 23, 2026
- MN: sui new employer rate Minnesota Department of Employment and Economic Development, Unemployment Insurance · Jan 1, 2026 · checked Oct 23, 2026
- MN: mn paid leave employer rate 1 30 employees Minnesota Department of Employment and Economic Development · Jan 1, 2027 · checked Nov 2, 2026
- MN: mn paid leave employer rate 31 plus employees Minnesota Revisor of Statutes (Minn. Stat. § 268B.14) · Jan 1, 2026 · checked Nov 2, 2026
- MN: minimum wage Minnesota Department of Labor and Industry · Jan 1, 2027 · checked Nov 3, 2026
- MN: paid sick leave hours worked per hour 1 plus employees Minnesota Department of Labor and Industry · Jan 1, 2024 · checked Oct 23, 2026
- MO: sui wage base Missouri Division of Employment Security · Jan 1, 2027 · checked Nov 11, 2026
- MO: minimum wage Missouri Department of Labor and Industrial Relations · Jan 1, 2026 · checked Nov 3, 2026
- MO: minimum wage Missouri Department of Labor and Industrial Relations · Jan 1, 2026 · checked Nov 3, 2026
- MT: sui wage base Montana Department of Labor & Industry, Unemployment Insurance Division · Jan 1, 2026 · checked Oct 23, 2026
- MT: minimum wage Montana Department of Labor & Industry · Jan 1, 2027 · checked Nov 3, 2026
- MT: minimum wage Montana Department of Labor & Industry · Jan 1, 2026 · checked Nov 3, 2026
- NE: minimum wage Nebraska Department of Labor · Jan 1, 2027 · checked Oct 25, 2026
- NE: paid sick leave hours worked per hour 11 19 employees Nebraska Department of Labor · Oct 1, 2025 · checked Oct 27, 2026
- NV: sui wage base Nevada Department of Employment, Training and Rehabilitation · Jan 1, 2027 · checked Oct 23, 2026
- NV: minimum wage Nevada Constitution, Article 15, § 16 · Jul 1, 2024 · checked Nov 2, 2026
- NH: minimum wage New Hampshire Department of Labor · Nov 3, 2026 · checked Nov 3, 2026
- NJ: sui wage base New Jersey Department of Labor and Workforce Development · Jan 1, 2026 · checked Nov 2, 2026
- NJ: minimum wage New Jersey Department of Labor and Workforce Development · Jan 1, 2027 · checked Nov 3, 2026
- NJ: minimum wage New Jersey Department of Labor and Workforce Development · Jan 1, 2026 · checked Nov 3, 2026
- NJ: paid sick leave hours worked per hour 1 plus employees New Jersey Department of Labor and Workforce Development · Oct 29, 2018 · checked Oct 23, 2026
- NM: sui new employer rate New Mexico Department of Workforce Solutions · Jan 1, 2026 · checked Oct 23, 2026
- NY: minimum wage Office of the Governor of New York · Jan 1, 2027 · checked Nov 3, 2026
- NY: minimum wage New York State Department of Labor · Nov 3, 2026 · checked Nov 3, 2026
- NY: paid sick leave hours worked per hour 5 99 employees New York State · Jan 1, 2021 · checked Oct 23, 2026
- NC: minimum wage North Carolina Department of Labor · Nov 3, 2026 · checked Nov 3, 2026
- ND: minimum wage North Dakota Department of Labor and Human Rights · Nov 3, 2026 · checked Nov 3, 2026
- OH: minimum wage Ohio Department of Commerce · Jan 1, 2027 · checked Nov 3, 2026
- OH: minimum wage Ohio Department of Commerce · Jan 1, 2026 · checked Nov 3, 2026
- OK: sui wage base Oklahoma Employment Security Commission · Jan 1, 2027 · checked Oct 23, 2026
- OK: minimum wage Oklahoma Department of Labor · Nov 3, 2026 · checked Nov 3, 2026
- OR: sui wage base Oregon Employment Department · Jan 1, 2026 · checked Oct 23, 2026
- OR: or paid leave employer rate 25 plus employees Paid Leave Oregon (Oregon Employment Department) · Jan 1, 2026 · checked Oct 23, 2026
- OR: minimum wage Oregon Bureau of Labor and Industries · Jul 1, 2026 · checked Nov 3, 2026
- OR: minimum wage Oregon Bureau of Labor and Industries · Jul 1, 2026 · checked Nov 3, 2026
- OR: paid sick leave hours worked per hour 10 plus employees Oregon Bureau of Labor and Industries · Jan 1, 2026 · checked Oct 23, 2026
- PA: minimum wage Pennsylvania Department of Labor & Industry · Nov 3, 2026 · checked Nov 3, 2026
- RI: minimum wage Rhode Island Department of Labor and Training · Jan 1, 2027 · checked Nov 3, 2026
- SD: minimum wage South Dakota Department of Labor & Regulation · Jan 1, 2027 · checked Nov 3, 2026
- UT: minimum wage Utah Labor Commission · Nov 3, 2026 · checked Nov 3, 2026
- VT: sui wage base Vermont Department of Labor · Jan 1, 2027 · checked Nov 11, 2026
- VT: minimum wage Vermont Department of Labor · Jan 1, 2027 · checked Nov 11, 2026
- VT: minimum wage Vermont Department of Labor · Jan 1, 2026 · checked Nov 3, 2026
- VT: paid sick leave hours worked per hour 1 plus employees Vermont General Assembly (21 V.S.A. § 482) · Jan 1, 2019 · checked Oct 23, 2026
- VA: minimum wage Office of the Governor of Virginia · Jan 1, 2027 · checked Nov 3, 2026
- WA: sui new employer rate minimum Washington Employment Security Department · Jan 1, 2026 · checked Oct 23, 2026
- WA: wa paid leave employer rate 50 plus employees Washington Employment Security Department · Jan 1, 2026 · checked Oct 23, 2026
- WA: sui wage base Washington Employment Security Department · Jan 1, 2027 · checked Nov 11, 2026
- WA: wa paid leave employer rate 50 plus employees Washington Employment Security Department · Jan 1, 2027 · checked Oct 23, 2026
- WA: minimum wage Washington Department of Labor & Industries · Jan 1, 2027 · checked Nov 3, 2026
- WA: paid sick leave hours worked per hour 1 plus employees Washington Department of Labor & Industries · Jan 1, 2026 · checked Oct 23, 2026
- WV: minimum wage West Virginia Division of Labor · Jan 1, 2016 · checked Nov 3, 2026
- WV: minimum wage West Virginia Division of Labor · Jan 1, 2016 · checked Nov 3, 2026
- WI: sui new employer rate Wisconsin Department of Workforce Development · Jan 1, 2027 · checked Nov 12, 2026
- WI: minimum wage Wisconsin Department of Workforce Development · Nov 12, 2026 · checked Nov 12, 2026
- WY: sui wage base Wyoming Department of Workforce Services · Jan 1, 2027 · checked Oct 23, 2026
- WY: minimum wage Wyoming Department of Workforce Services · Nov 3, 2026 · checked Nov 3, 2026
- Chicago: minimum wage City of Chicago, Office of Labor Standards · Jul 1, 2026 · checked Nov 3, 2026
- Denver: minimum wage Denver Labor (Denver Auditor's Office) · Jan 1, 2026 · checked Nov 3, 2026
- Denver: denver opt monthly City and County of Denver, Department of Finance · Jan 1, 2026 · checked Oct 23, 2026
- Jersey City: jersey city payroll tax rate City of Jersey City, Division of Finance · Jan 1, 2026 · checked Oct 23, 2026
- Los Angeles: minimum wage City of Los Angeles Office of Wage Standards · Jul 1, 2026 · checked Nov 3, 2026
Frequently asked questions
What does the Hiring Cost Atlas cover?
All 50 states and DC plus 12 cities with their own employer rules, for 2026 and 2027: 829 values in all, from unemployment insurance wage bases and new-employer rates to paid leave premiums, paid sick leave, workers' comp index rates, health contributions and minimum wages.
Where does the data come from?
From 78 official publishers: the Social Security Administration, the IRS and the U.S. Department of Labor for federal taxes, state labor and workforce agencies and statutes, the Oregon Department of Consumer and Business Services for workers' comp and the Agency for Healthcare Research and Quality for health premiums.
Can I use this data in an article or a product?
Yes, including commercially, under the Creative Commons Attribution 4.0 license: credit “LeadChange Group, Hiring Cost Atlas” and link to this page.
Is there an API?
Yes, read-only and free: one JSON list of the states with their standard-scenario totals, and one JSON document per state with its parameters and sources, cached and rate-limited. The CSV and JSON downloads hold every value with its source.
Which states cost employers the most?
On a $50,000 salary in 2026, New York (28.5%), New Jersey (27.9%), Hawaii (27.5%) top the ranking; Arizona (20.5%) and Arkansas (20.5%) are lowest.
How often is the atlas updated?
Every source is checked again at least every 30 days and when agencies announce new rates; this edition was checked on Oct 30, 2026. Values for 2027 not yet published are marked as carried from 2026. A 2027 minimum wage with an effective date before 2027 is a rate still in force on January 1, 2027, with no increase for that day enacted on the check date; a step later in 2027 is listed as minimum_wage_mid_year.
How do I cite the Hiring Cost Atlas?
Cite “LeadChange Research Team, Hiring Cost Atlas, LeadChange Group” with the date you accessed it and a link to this page. For a single value, the official source in its row is the primary source.
Use the data
- Employee Cost Calculator
The same numbers as a calculator, for any state, salary or hourly wage.
- Minimum wage by state
Every state’s minimum wage, the 2027 rates already announced and city rates.